Mago Memories Analytics: See What Visitors Touch, Scan and Look At

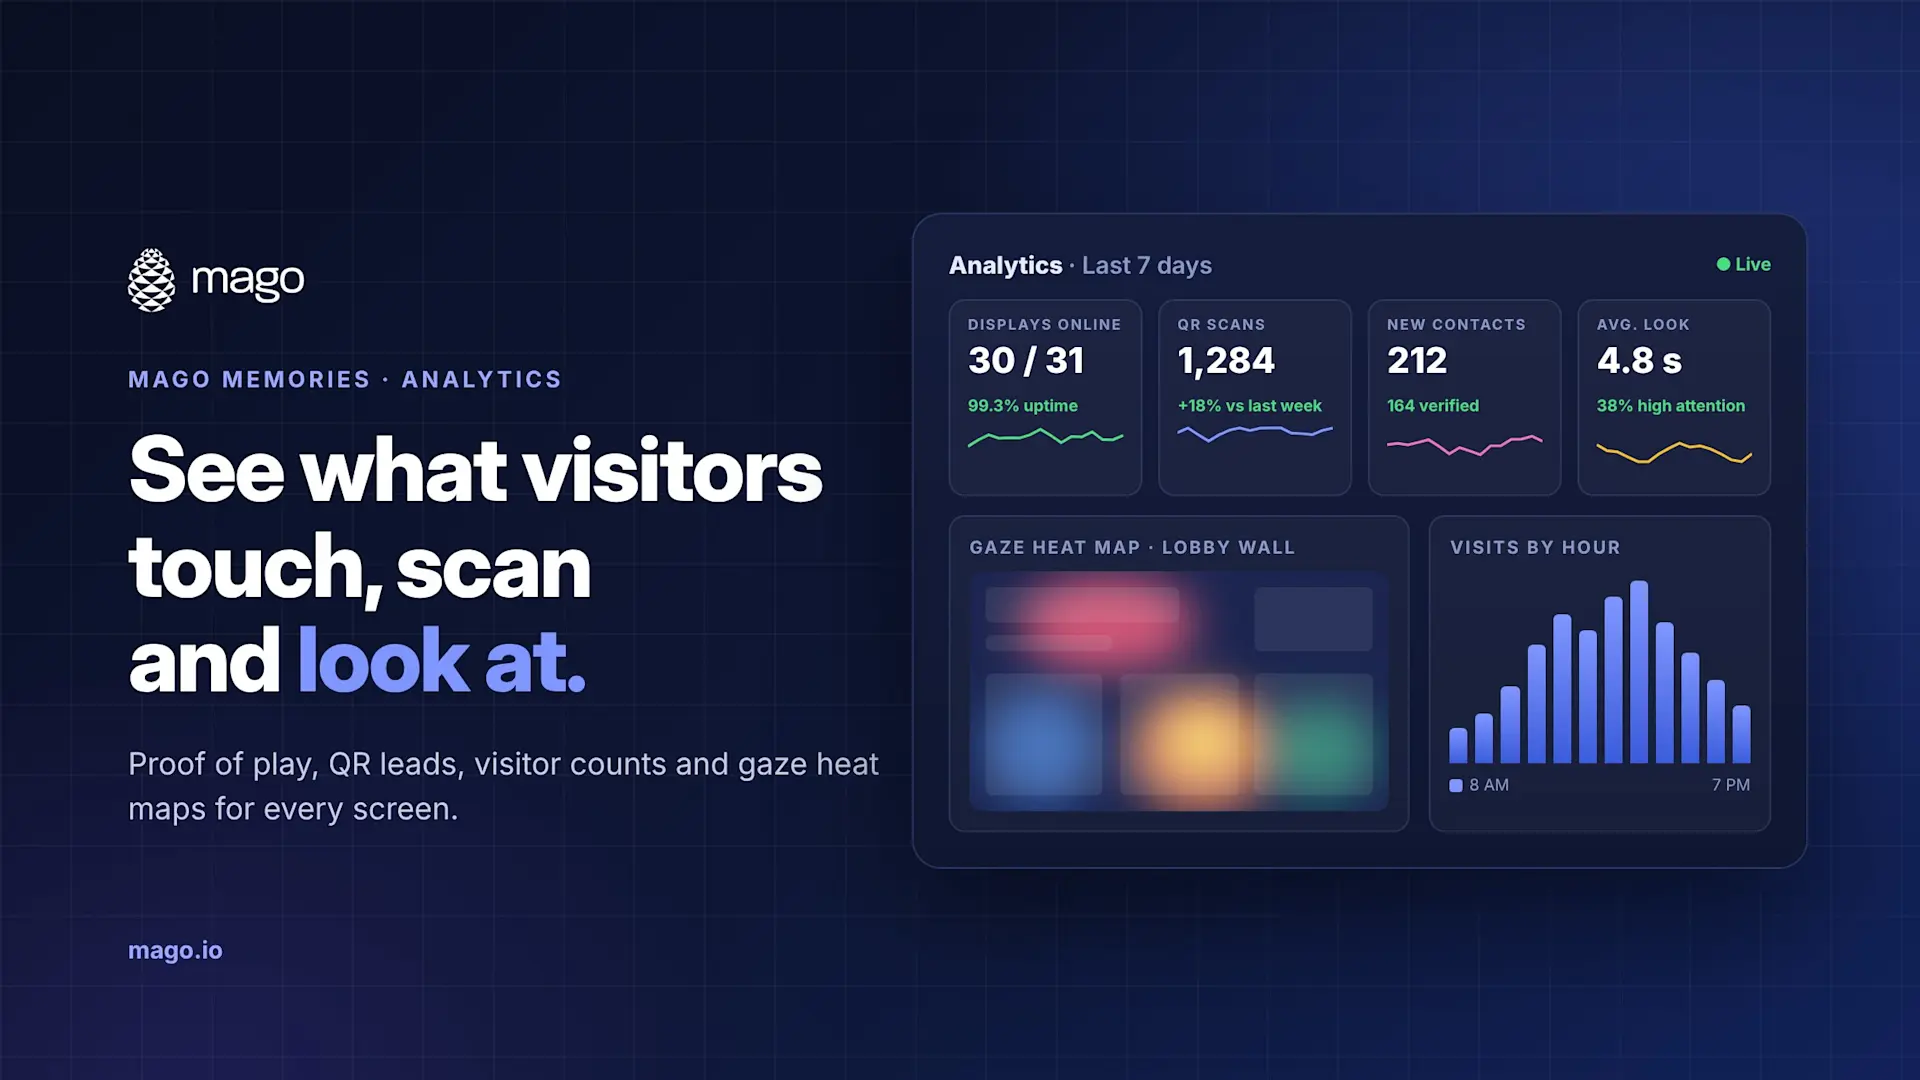
Mago Memories analytics shows what every interactive screen is doing: which displays are online, what played, which products people touched, which QR codes turned into leads, how many visitors stopped and, on Enterprise, what they actually looked at.
Passive signage plays to nobody. Mago Memories turns touchscreens, LED walls, video walls and projections into stories visitors tap, open and take home on their phone.
Once a screen is engaging, the next question is whether it is working. Which products did people open? Which QR codes turned into leads? Did anyone actually stop and look? That is why analytics is the feature customers ask about most.
Every Mago Memories account has a built-in Analytics page for Publishers and Admins. It refreshes every minute, and you choose the period, from the last 24 hours up to 12 months on Enterprise.
Watch Cristiano Fumagalli walk through gaze tracking, the analytics dashboard and heat maps in under four minutes:
What does the live view show?
The top of the Analytics page refreshes every 10 seconds and shows what is happening right now.
Live
A globe shows who is connected: your displays, the people working in the editor and your visitors' phones. They are counted and placed by city, never by street address. Point at a city to see the displays and people there, drag the globe, or switch to a flat map.
Use
Over 24 hours, 7 days or 30 days, see how many displays, editors and phones were connected at once, plus the plays, touches, QR code scans and visitors' photos and videos. Touches and QR scans sit side by side, so you can see how people prefer to engage.
Security of your accounts
Administrators also get a 30-day security view: accounts locked after five wrong passwords, sign-ins after several failed attempts, recovery codes used instead of the authenticator app, and the address and city of repeated wrong passwords. If something looks unexpected, you know who to check with.
How do you prove content played?
The numbers at a glance
Six key figures sit at the top of the report: displays online now, average uptime, time on screen, QR code scans, new contacts (with how many verified their email) and visits, when interaction counting is on.
Displays and uptime
Each display shows its uptime over 24 hours, 7 days and 30 days, when it was last seen and the city it last connected from. A screen that dropped offline in a far-off lobby is easy to spot.
What played
Every item and story is listed with how many times it was shown, its time on screen and how many displays played it. For sponsors, brand partners or internal stakeholders, that is proof the content ran where and when it should. Enterprise adds CSV export.
It keeps counting when the network drops. Each display queues proof of play and interaction counts and sends them every minute, including what played while it was offline.
How does a touch become a contact?
This is where interactive signage turns into pipeline.
Products
For every product card in an interactive story, the report shows:
- How often it was touched
- How often its QR codes were scanned (files, links and 3D models)
- The contacts and verified contacts that followed
- The scan-to-contact rate
You see which products draw a crowd and which ones turn into real conversations.
QR codes and contacts
Visitors scan a QR code to take a catalog, brochure or 3D model home, and can leave their details first. Each QR code shows its scans, contacts and verified contacts. Every contact lands in one list with the date, name, email, company, what they asked for and the display they used. Your team gets an email for each new contact, and the list exports as CSV on every edition, ready for your CRM.
Visitors
Turn on visitor interaction counting and you get visits per day, visits by hour of the day, and the scenes and cards opened most. A visit starts when someone touches a display after a minute without touches. The counts are anonymous.
What do people actually look at?
A touch tells you what someone chose. Gaze tells you what caught their eye before they chose anything. Audience measurement is part of the Enterprise edition.
How audience measurement works
With audience measurement turned on for a display, its camera is analyzed on the display itself, about six frames a second at low resolution, and every frame is discarded at once. Faces are followed only while they stay in front of the screen and are never recognized later. When a person leaves, the display reports one anonymous summary: seconds in front, seconds looking, attention level, what was on screen, and whether they touched the display or scanned a QR code.
What the audience report shows
- People in front and looked at it: how many people passed and how many actually looked.
- Average look and high attention: attention is graded low (under 2 seconds), medium (2 to 6 seconds) or high (6 seconds or more).
- Touched after looking and scanned a QR code: whether a look turned into an action.
- What they looked at, by display and by hour: which content holds attention, and when.
All of it exports as CSV.
Heat maps and attention zones
Gaze also becomes heat maps by zone and by page. Hot zones show the headlines, products and images that pull people in. Cold zones show content people walk past.
- Fix layouts that get ignored: if the call to action sits in a cold zone, move it to where eyes already land.
- Compare versions: run two versions of a story and compare their heat maps.
- Spot interest that never becomes a tap: a product with long looks but few touches may need a clearer prompt or a QR code.
Interaction beyond touch
The same camera lets people interact hands-free. A visitor raises a hand beside their face to turn on gaze control, then holds their gaze on a card for about three seconds to open it. That is a natural fit for large LED walls and projections, where nobody can reach the top of the screen. Every gaze tap feeds the same analytics.
Can you connect sensors and Power BI?
Yes, on Enterprise. You can bring the room itself into the report.
- Sensors: people counters, presence, temperature, humidity, CO2 and noise next to the displays, with daily values and CSV export. A presence reading can even wake a display when someone walks up.
- Power BI and Excel: read-only data feeds for plays, displays, uptime, QR codes, interactions and sensors, so Mago Memories data sits next to the rest of your business reporting.
- Integration keys: customer admins create sensor keys and feed keys in a few clicks, up to 50 per account.
How is visitor privacy protected?
Analytics is built to be useful without being invasive.
- Anonymous by default: locations are shown by city, never by address. Visitor counts are anonymous and off until you turn them on. Audience measurement keeps no images and no identities.
- Consent for leads: the contact form links to your privacy policy, and contacts can be deleted on request.
- A notice next to the screen: camera analysis of people is still personal-data processing under GDPR, so Mago Memories gives you suggested notice text to place next to every display that measures.
- Role-based access: analytics is visible to Publishers and Admins, not to Editors.
| Cloud | Enterprise | |
|---|---|---|
| Reporting period on screen | Last 30 days | Up to 12 months |
| Live view, key figures, uptime, proof of play | Yes | Yes |
| Products, QR codes, contacts and CSV contact export | Yes | Yes |
| Visitor interaction counts | Yes | Yes |
| CSV export of what played | No | Yes |
| Audience measurement (camera, gaze, heat maps) | No | Yes |
| Sensors, Power BI and Excel feeds | No | Yes |
Hourly totals and scans are kept for 400 days, and contacts stay until you delete them.
Frequently asked questions
Does Mago Memories include analytics?
Yes. Every account includes a live view, key figures, uptime, proof of play, product touches, QR scans and contacts, with optional anonymous visitor counts.
Do I need a camera to get analytics?
No. Without a camera you still get touches per product, QR scans, contacts, proof of play and visits by day and hour. The camera adds audience measurement on Enterprise.
Can Mago Memories track what visitors look at?
Yes, on Enterprise. With a camera above or below the middle of the screen, it reports people in front, look time, attention levels and what they looked at, with heat maps by zone and page.
Does the camera store faces or video?
No. Frames are analyzed on the display and discarded at once, and faces are never recognized later. Only an anonymous summary per person is sent.
How long is analytics history kept?
Cloud shows the last 30 days; Enterprise shows up to 12 months. Hourly totals and scans are kept 400 days, and contacts until you delete them.
Can I connect Mago Memories to Power BI?
Yes. Enterprise includes read-only feeds for Power BI and Excel covering plays, displays, uptime, QR codes, interactions and sensors.
How much does Mago Memories cost?
Cloud is $9 per display per month (USD, excl. VAT) with a 15-day free trial. Enterprise, including audience measurement, sensors and Power BI, is quoted for your own servers or private cloud.
See it on your screens
Interactive signage should do more than play. It should tell you what your visitors care about. Start a 15-day free trial with a ready-made demo story, or book a 30-minute demo and we will walk you through the reports. New to the product? Start with what Mago Memories is.